The stock market lost 10% of its value this month and a few investors are asking me, in a panic, what they should do. These are investors without a short-term or a long-term plan. If your stock portfolio is money that you won’t touch for 30 years, this 10% fall is likely to be an insignificant blip over that time horizon. However, if you’re counting on using this money within the next 20 years, then you need a proactive plan.
As a stock-market investor, one of the most important questions to evaluate is: Is the stock market under valued or over valued? To answer this question, investors and researches have come up with countless reference points to consider:
- Historical price/earnings ratio
- Is the Federal Reserve raising or lowering interest rates
- Price moving averages up or down
- Creating a price ratio against real estate, gold, crude oil, or commodity index
- The historical dividend ratio
- And many more
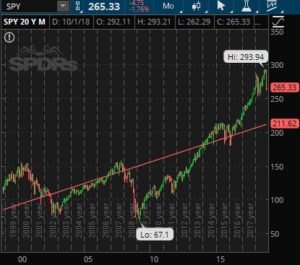
The S&P 500 stock index chart with this post includes is a 20-year linear regression line in red. A linear regression line is an average of the data points. In this case, when the stock market is below the linear-regression red line would be considered under-valued for the last 20 years while above the red line would be over-valued. On Friday, this stock market average closed at 265 which is 25% above the linear regression line. This means that the stock market could fall an additional 25% to order to return to its 20-year price average. If you knew the stock market may fall an additional 25% – what would you do? The farther the stock market moves above or below the regression line increases the likelihood that it will return to the average.
Just because an asset or investment class is over-valued does not mean that it cannot become 3 times more over-valued from its current price. For example, I believed the U.S. stock market was way too over-valued in late 1996 and sold everything. Only to watch the market sprint higher for 3 more years before it collapsed. In the case of the stock market, there are people that study the major price tops to determine what is unique about them so they can predict the next one. Again, there are many reference points for a top: a lowering of the stock market advance/decline line; people with minimum-wage jobs day trading on the side and offering stock tips; a “blow-off top” of rapid upward price acceleration and volatility; large increases in interest rates, etc.
It is true that the stock market is high and the Federal Reserve is raising short-term interest rates. This alone should make anyone cautious about their stock portfolio, and consider selling off some of their stocks. However, there hasn’t yet been the classic “topping behavior” of a major stock market high. I recommend that you consider reducing your exposure to stocks, and yet maintain some, because the stock market could still continue upward for another 1-3 years and you may want to capture those gains.
Each market top is unique and today’s economic environment includes something very different as well:
- The U.S. Federal Reserve is reducing their balance sheet by selling off $50 billion a month in bonds.
- The U.S. Federal Reserve is requiring the U.S. Treasury to pay them back the money they borrowed for 2009’s Quantitative Easing, payments of $30 billion a month. This is money that the Treasury has to borrow by issuing more bonds.
- The growing federal deficit now requires issuing $80-90 billion per month in Treasury bonds.
These three chronic factors flooding the bond market are becoming more difficult for the market to purchase. This is soaking up capital that had been flowing into the stock and bond market for the last 9 years. So the largest players in the financial markets are creating a rocky foundation that is adding to market volatility, perhaps ending this bull stock market of the last 9 years.

