Investing Archives - Page 3 of 11 - Financial Literacy

Archive for Investing

Stock-market timing update

Last October, I pointed out that the U.S. Federal Reserve had announced their schedule of selling off assets every month going forward. This draws money out of the economy and the stock and bond markets would have an adverse response going forward. I advised at that time to consider reducing your exposure to stocks and bonds from rising interest rates by March 2018.

Since that post, the stock market moved up for 2 months,and then began a sideways channel with high volatility. The stock market is still in that volatile channel while interest-rate sensitive bonds have dropped some in value.

I’m no oracle; I simply followed the largest player manipulating the economy and their announcements. With the recent unfavorable stock market volatility, the Federal Reserve has hinted that their plan of raising interest rates any further will be paused for the next quarter.

For stock market timing, a reference point that I always track is: the stock market making a 15% fall from its most recent high. If you examine stock market volatility and following its price trends, then the general timing rule is to:

A) Exit or reduce stocks if the stock market falls 15% from its most recent major price high point.

B) Enter or add more when the stock market rises 15% from its most recent major price low point.

If you are timing the stock market yourself with a method similar to this, using a percentage less than 15% will have you trading too often and getting whip-sawed from normal volatility. If you use a percentage much more than 15%, then you’re taking on too much risk and riding a downturn longer than was prudent. When you exit stocks at a 15% drop, you are minimizing your losses on what could grow into a 25%-50% loss – which would be devastating to your investment goals. (Note that this 15% rule is only for a general stock market index – a particular stock or commodity may need a percentage far above or below this amount.)

Today, the most recent price high point for the S&P 500 is 2,941 on October 1st and is currently trading at 2,650 this is just a -9.4%price drop. So for right now, it is not signaling to exit all of your stock positions yet. That signal price is if the S&P 500 drops to 2,117. Of course, you are free to sell off a portion to reduce your risk in this time of volatility or anytime you’re uncomfortable with the economic outlook.

Stock chart of the day

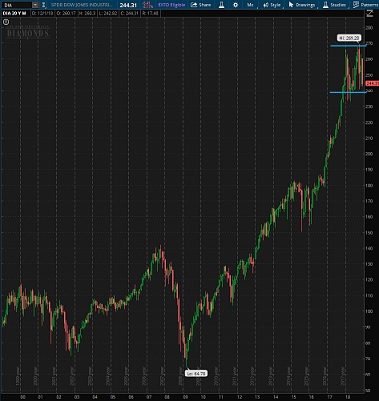
The stock market lost 10% of its value this month and a few investors are asking me, in a panic, what they should do. These are investors without a short-term or a long-term plan. If your stock portfolio is money that you won’t touch for 30 years, this 10% fall is likely to be an insignificant blip over that time horizon. However, if you’re counting on using this money within the next 20 years, then you need a proactive plan.

As a stock-market investor, one of the most important questions to evaluate is: Is the stock market under valued or over valued? To answer this question, investors and researches have come up with countless reference points to consider:

  • Historical price/earnings ratio
  • Is the Federal Reserve raising or lowering interest rates
  • Price moving averages up or down
  • Creating a price ratio against real estate, gold, crude oil, or commodity index
  • The historical dividend ratio
  • And many more

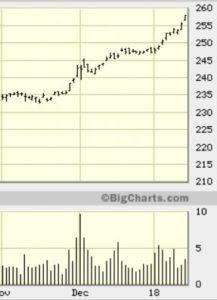
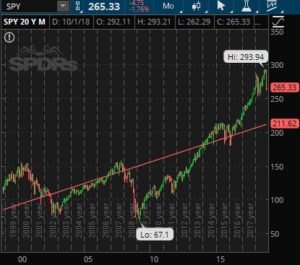
The S&P 500 stock index chart with this post includes is a 20-year linear regression line in red. A linear regression line is an average of the data points. In this case, when the stock market is below the linear-regression red line would be considered under-valued for the last 20 years while above the red line would be over-valued. On Friday, this stock market average closed at 265 which is 25% above the linear regression line. This means that the stock market could fall an additional 25% to order to return to its 20-year price average. If you knew the stock market may fall an additional 25% – what would you do? The farther the stock market moves above or below the regression line increases the likelihood that it will return to the average.

Just because an asset or investment class is over-valued does not mean that it cannot become 3 times more over-valued from its current price. For example, I believed the U.S. stock market was way too over-valued in late 1996 and sold everything. Only to watch the market sprint higher for 3 more years before it collapsed. In the case of the stock market, there are people that study the major price tops to determine what is unique about them so they can predict the next one. Again, there are many reference points for a top: a lowering of the stock market advance/decline line; people with minimum-wage jobs day trading on the side and offering stock tips; a “blow-off top” of rapid upward price acceleration and volatility; large increases in interest rates, etc.

It is true that the stock market is high and the Federal Reserve is raising short-term interest rates. This alone should make anyone cautious about their stock portfolio, and consider selling off some of their stocks. However, there hasn’t yet been the classic “topping behavior” of a major stock market high. I recommend that you consider reducing your exposure to stocks, and yet maintain some, because the stock market could still continue upward for another 1-3 years and you may want to capture those gains.

Each market top is unique and today’s economic environment includes something very different as well:

  1. The U.S. Federal Reserve is reducing their balance sheet by selling off $50 billion a month in bonds.
  2. The U.S. Federal Reserve is requiring the U.S. Treasury to pay them back the money they borrowed for 2009’s Quantitative Easing, payments of $30 billion a month. This is money that the Treasury has to borrow by issuing more bonds.
  3. The growing federal deficit now requires issuing $80-90 billion per month in Treasury bonds.

These three chronic factors flooding the bond market are becoming more difficult for the market to purchase. This is soaking up capital that had been flowing into the stock and bond market for the last 9 years. So the largest players in the financial markets are creating a rocky foundation that is adding to market volatility, perhaps ending this bull stock market of the last 9 years.

Signals from the bond-yield curve

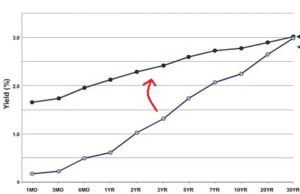
The yield curve is a plot of bond fixed-interest returns over time. The near term rates from bonds are generally lower than longer-term rates, so the chart’s curve slopes up to the right. This shape of this bond-yield curve is normal. However, the curve points fluctuate every day and sometimes the yield curve is flat or even temporarily inverted.

As you can see in the chart, now is one of those times when the yield curve is flattening. Historically, a flattening yield curve indicates that the bond markets are expecting a recession in 6 months. All of the financial publications are now writing about a possible recession from this signal. Many times, this is true; but it my opinion, not as likely this time.

Today, there are forces creating the inverted yield curve that have nothing to do with the underlying U.S. economy. First, the U.S. economy is booming across most industries: transportation, manufacturing, and services are having their best growth in 14 years while unemployment is at a 17-year low. So the economy is performing well, so why the inverted yield curve?

The U.S. Federal Reserve is raising short-term interest rates, the near point on the chart. However, slow economies and low inflation in Europe and Japan have interest rates near zero. As long as their interest rates remain so low, higher interest rates in the U.S. will be attractive to investors around the world, keeping longer-term yields low as well.

Yes, there are currency moves and currency hedging to consider. But as long as U.S. rates remain far above European and Japanese rates, then investment funds and central banks will continue to purchase longer-dated U.S. bonds. In my opinion, Central Banker maneuvers around the world is what is causing gyrations in the U.S. yield curve and they are not impacted by any potential recession coming soon.

(Wall Street has two ridiculous funds for trading the yield curve. There is one to profit from a steepening yield curve (ticker symbol STPP) and another one to profit from a flattening yield curve (ticker symbol FLAT). While the yield curve has been flattening for the last 2 years, had you invested in FLAT you would have lost 6% of your money. As mentioned in the blog post from 3 weeks ago, be very wary of Wall Street gimmicks).

Be wary of Wall Street gimmicks

The ETF (exchange traded fund) landscape is littered with failed investment fads, gimmicks, tricks, niche ideas, and junk. In 2017 alone, 150 ETFs were closed for failure to attract enough investors – which normally happens for funds that fail to perform.

Back around 2011, I learned of an ETF with great promise. A smart researcher designed it using market timing models on a very diverse asset classes and I bought some right away. While many of the asset classes were going up, this dog went nowhere for a year until I dumped it. Once a year, I’d check and it remained flat for 6 years until it finally closed for lack of investor interest. ETF management companies throw spaghetti at the wall with all kinds of niche products. A few of the ETFs that closed last year include these fund ideas:

  • Double inverse silver mining companies fund
  • Stock-price splits fund
  • Regional banking fund
  • Solar energy fund
  • Spanish large-cap fund
  • Municipal bond fund with 12-17 year expiration

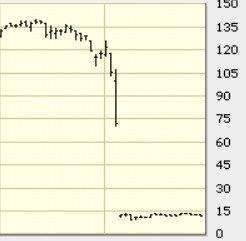
Under-performance is one problem but a larger problem can be a structural weakness of a fund. For example, how would you like to own the ETF in the chart above? One day it is at $125 and a week later it has fallen by 90% to $11. This is an inverse volatility fund and there is a whistleblower with details regarding fake volatility quotes (called spoofing) that is allowing risk-free profits to scammers. Other funds, such as low-volatility versions of the S&P 500 fell just as violently as the regular S&P 500 over the last month. Investors in this fund were giving up some upside capital-gain potential in exchange for price stability, but the moment you actually need that stability, it disappeared.

As I see it, there are tactics and strategies that work in specific market environments. But when that environment changes, these strategies frequently fail. Until there is a long track record of validated success for an investment strategy, it is best to stick with what has worked for decades, rather than chase the gimmick of the season.

Stock market hitting interest rate headwinds

I received a few panic phone calls two weeks ago about the fall in the stock market. “Should I sell everything right now?” was the most common question. While I am not a registered investment adviser, there are some general comments that I can provide.

The U.S. economy has been performing so well lately that inflation is starting to tick upward for the first time in a decade. (Increasing inflation prompts bond investors to require a higher interest rate. Bonds have an inverse relationship to interest rates. The price of a bonds falling is the equivalent of interest rates rising). In the last two weeks, price indexes have been rising, which is an indicator of future inflation, so bond prices have fallen to reflect higher interest rates. (In addition, this makes it more difficult for stock prices to rise. This is because the interest rate used to discount future company earnings into a company’s stock valuation goes up as well, putting downward pressure on stock prices).

Rather than write a primer about bond and stock investing and the impact of interest rates, suffice it to say that: as interest rates rise, bonds will fall and stocks will have a tougher time advancing. Interest rates are rising across the yield curve (2 year, 5 year, 10 year, and 30 year bonds). So anything interest-rate related will likely have a higher rate going forward. This would include: mortgages, car loans, credit cards, but also savings accounts and bank certificates of deposit.

As interest rates rise, you may want to consider reducing your allocation to bond funds and possibly your stock funds to lock in some of the gains over the last several years.

Stock market still powering upward

The National Association of Active Investment Managers currently has their highest exposure to equities in the last dozen years. They are extremely optimistic. This is partially fueled by:

  1. U.S. manufacturing is running flat out and is limited by not being able to hire more workers.
  2. Small business optimism index is at an all-time record high.
  3. Washington’s cuts in regulations along with personal and corporate income tax.
  4. The U.S. Federal Reserve not reducing their balance sheet, however, this news isn’t widely known.

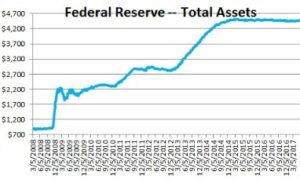
After the financial crisis of 2008, the U.S. Federal Reserve increased its balance sheet by $4.5 trillion. This added liquidity to the economy and boosted all kinds of asset prices. Well, the time has come to reduce their balance sheet which will put downward pressure on all kinds of assets: stocks, bonds, real estate, etc. In September, the Federal Reserve announced the details of reducing their balance sheet starting in October 2017. I wrote about this at the time and recommended lightening up on your stock and bond exposure over the next 6 months.

Well, the Federal Reserve has NOT followed through with their plan. They were supposed to have sold off $30 billion already and an additional $50 billion by the end of January. Instead of this $80 billion reduction in their balance sheet, they’ve only sold $5.9 billion. Four months into their reduction plan and they are already 93% behind schedule.

Since the Fed isn’t putting on the brakes, along with all of the business and consumer optimism, plus the huge tax cut that will play out over the next 6 months, it’s my opinion that the stock market uptrend is far more likely to continue this year. But of course, there are always a dozen exogenous potential events to spoil the party (such as: China holds $3.1 trillion in U.S. bonds and the Chinese Central Bank is recommending slowing or halting future purchases). So ride the current stock market trend a little longer.

A million dollar portfolio is not impossible

Today, a little over 4% of Americans are millionaires; meaning that they have invested assets over a million dollars. Fidelity and the Spectrum Group put together some information about the average millionaire. A few of their findings include:

  1. Median annual income was just $125,000
  2. The majority are married (76%)
  3. The majority have a Bachelor’s degree (83%), or a graduate degree

Their investment mix is:

  • 44% stocks
  • 15% fixed investments (like bonds)
  • 15% short-term investments (like CDs)
  • 26% other (real estate, gold, privately-held businesses)

Given their medium income is only twice the national average income, it is likely that two working professionals (each earning just $62,500) could be earning the same or more money than many millionaires. We can deduce that the average millionaire keeps their cost-of-living low so that they can pile up money and invest it. And that is how they eventually became millionaires.

Ivory-tower and media forecasts are usually wrong

The last 12 months have shown that the media and governing elites have no idea what they are talking about. Let’s review just a few of the most glaring examples:

  1. Donald Trump has zero chance of winning the presidential primaries, let alone the presidency. If Donald Trump wins the presidential election, the stock market and economy will collapse. (He won, and jobs are increasing).
  2. Britain will never leave the European Union. If Britain does leave the EU, the British economy will implode. (The British voted to leave, their economy is doing very well).
  3. If India removes high-denomination paper currency, it will reveal huge untaxed wealth and terrorism financing because they won’t turn in the soon-to-be-banned currency. Experts and economists estimated that only 50-60% of that banned currency will be turned in to banks. (But 99.9% of it was turned in). Once large currency is banned and the Indian Central Bank controls more of the economy, the economy will greatly improve. (Removing large denomination currency eliminated an estimated 5 million jobs, small businesses closed for lack of capital, and agricultural prices collapsed which financially crushed farmers; who are now protesting).
  4. The Venezuelan dictator, Maduro, certainly won’t let his countrymen starve from socialism. (Not only has 75% of Venezuelans lost 19 pounds over the last year from a lack of food, Maduro is consolidating more political power to enact even more destructive socialism where poverty has now engulfed 90% of the population).
  5. There is no way the Obama administration wiretapped or spied on the Trump presidential campaign. (Turns out several U.S. security agencies actually did, without cause or warrant, and Obama appointees made hundreds of “Unmasking” requests for the names of people working on Trump’s transition team so they could leak their names to the media to create political damage).
  6. The U.S. Federal Reserve has raised interest rates 3 times in the last 3 years to get ahead of increasing inflation from the low unemployment rate. Investment advisers and media kept forecasting that this was the correct move. (Oops, new inflation numbers show that inflation is declining, not increasing, plus the velocity of money keeps declining. This means that the Federal Reserve experts have been doing the wrong thing: raising interest rates into economic weakness, exacerbating the problem).

You need accurate information in order to make planning decisions for investing, career, and business. Economists, political analysts, and investment advisers that are using an inaccurate world-view frequently make highly-inaccurate forecasts of major events. If your sources of news were totally wrong about these major events, then you may want to find some new sources of information that are using a far more accurate world view.

The U.S Federal Reserve is making a major transition

In the 2008 financial crisis of too much debt, the Federal Reserve acted by:

  1. Lowering interest rates to near zero
  2. Buying $4.5 trillion in loans and bonds, putting money into the economy

Lower interest rates made debt easier to service and pushing so much money in the economy re-inflated the stock market and real estate price bubbles over the last decade.

This week, the Federal Reserve announced that they are changing course and will start reducing their balance sheet. Starting next month, they will sell $10 billion a month, increasing each quarter until it is $50 billion a month. This is a reduction in the money supply of the banking system, the fuel of the economy.

At the same time as the Federal Reserve is effectively withdrawing money from the banking system, the U.S. Treasury wants to add another $600 billion to their Rainy-Day Fund, which will withdraw even more money from the money supply.

What does this mean?

There will be less money for primary treasury dealers so there will be less demand for all kinds of securities: stocks, bonds, and U.S treasury securities. Yes, sovereign wealth funds and other central banks are buying U.S. securities, but the combination of the Fed and Treasury is a withdrawal of $1.3 trillion from the U.S. banking system by 2020. That is going to show up in lower prices, sooner or later.

Don’t be the last person to realize the music has stopped and your portfolio is down by 40%. The stock and bond markets are still strong today, so consider is selling some off each month and then leaving that money in cash. There is no way that anyone can time a stock & market top. However, to reduce your risk, I’d offer a vague target of reducing your stocks, bonds, and mutual funds so that in 6 months, at least 50% of your portfolio is in cash.

Are asset bubbles about to pop?

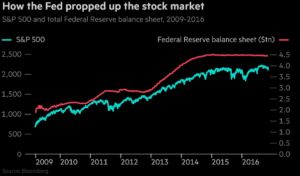
It has been nearly 10 years since the global financial crisis was caused by skyrocketing defaults on mortgages. In the chart you can see the U.S. Federal Reserve’s response to the crisis: they stepped in and bought bad loans and bonds to provide liquidity that kept banks solvent. Their continued buying has expanded the balance sheet of the Federal Reserve by over $4 trillion dollars. This money has flowed into and created price bubbles in the stock, bond, and real estate markets.

The U.S. isn’t the only central bank propping up markets like this; the Bank of Japan, the Bank of England, and the European Union central bank is also buying bonds and stocks every month. The Swiss central bank is now among the largest owners of Apple and Tesla stock shares. It used to be called socialist nationalization when governments bought companies, but in today’s upside down world of Newspeak, it is now labeled “providing liquidity to the market.”

This month, the U.S. Federal Reserve is going to begin a reverse program of reducing their balance sheet by starting to sell bonds each month. The red line on the chart will begin a steady decline. Pulling money out of the economy must be a contracting force to the economy, and so the blue line of the stock market will likely decline along with it.

Are you positioned for a possible decline in asset bubbles, like the stock, bond, and real estate markets? Consider this your Early Warning Alert of a likely decline in the next few years.

Menu Title